Perform Accurate Analysis with Our Charts and Trading Tools

Support to Our Community of Users in CryptoMKT
Our platform has a large community of users, many of them experienced traders who have developed their skills self-taught. However, we know that facing challenges in making informed decisions and anticipating market fluctuations in a global context is a constant reality.
Innovative Solutions to Maximize Benefits and Reduce Risks
At CryptoMKT, we focus on providing innovative solutions that help our users maximize their profits and reduce their risks. To achieve this, we offer a wide variety of tools and resources, including:
Market Analysis Tools: Access to advanced charts, technical indicators and various analysis tools to better understand market trends.
Information Updated in Real Time: We provide real-time data on the latest trends and events affecting the cryptocurrency market, allowing users to make informed decisions quickly.
Educational Resources: We offer guides, tutorials and articles that help users improve their trading knowledge and skills.
Active Community: We foster an active community where users can share experiences, strategies and advice, thus enriching collective knowledge.
Our commitment is to support our users, whether they are beginners or experienced traders, so that they can confidently and successfully navigate the world of cryptocurrencies. With our tools and resources, we seek to empower our community to make informed decisions and take full advantage of market opportunities.

Advanced Tools to Analyze the Market in CryptoMKT
With these new tools, you will be able to access state-of-the-art statistical indicators to analyze the market with greater precision. You will obtain a clear and detailed vision of the market, which will allow you to make better decisions and increase your income significantly.
Depth Chart
The Depth Chart is an essential tool that will allow you to measure the number of buy and sell orders in real time. With this information, you will be able to evaluate market variations and behaviors, helping you plan your investment strategies more effectively.
Benefits of Depth Chart:
Real Time Viewing: Monitor buy and sell orders in the market in real time to identify important trends and movements.
Liquidity Assessment: Determines market liquidity by looking at the amount of assets available for purchase or sale at different price levels.
Strategy Planning: Use the information obtained from the chart to plan and adjust your investment strategies, maximizing your chances of success.
Identification of Supports and Resistances: It recognizes key support and resistance levels, making it easier to make decisions about when to enter or exit the market.
With these advanced tools and the Depth Chart, CryptoMKT offers you the resources necessary to navigate the cryptocurrency market with confidence and precision. Take advantage of these advantages to improve your trading skills and increase your income significantly.

Indicators
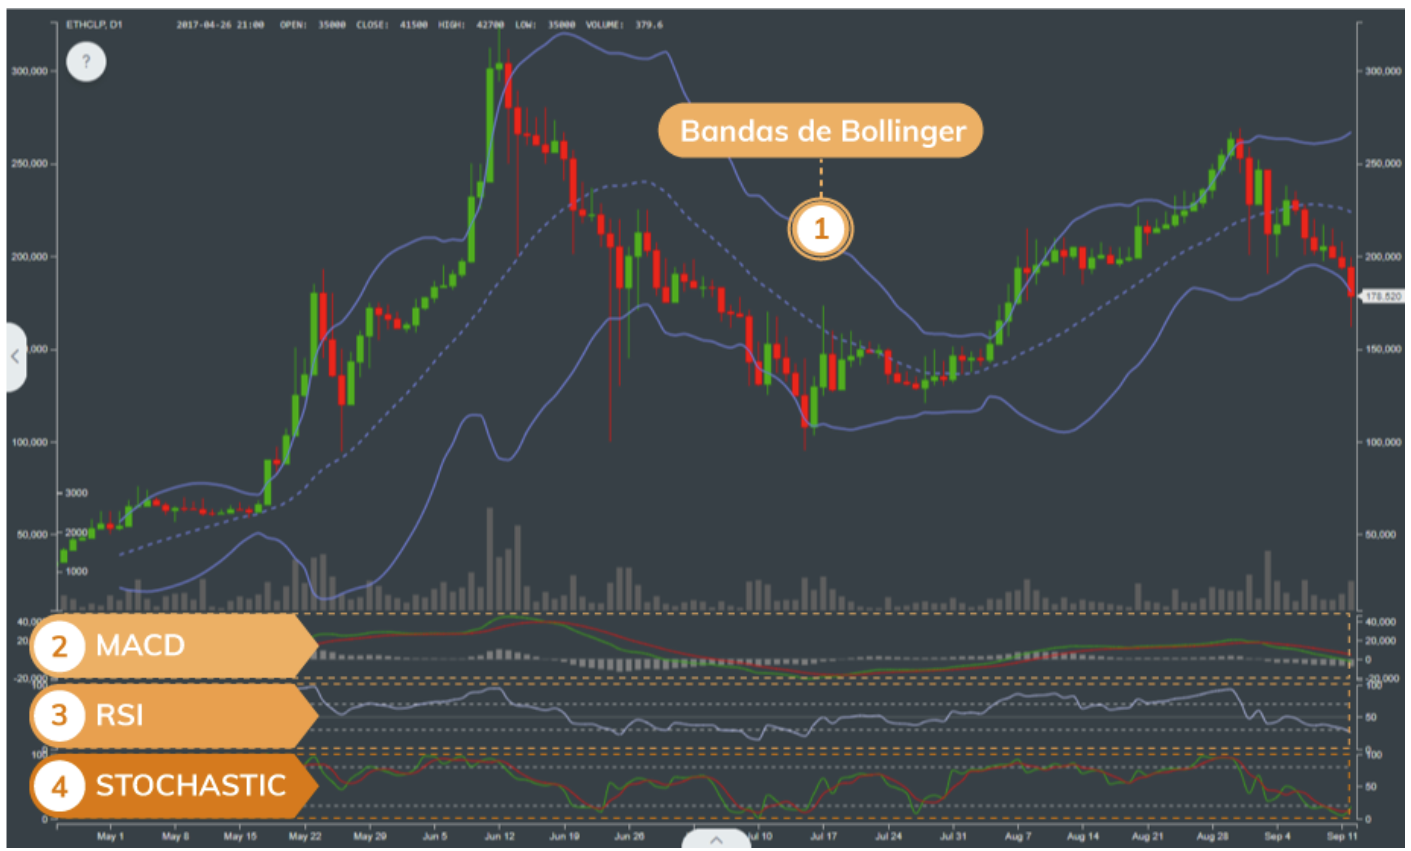
So that you can make informed decisions and adjust your investment strategies, we have incorporated various statistical indicators that will help you better understand and visualize prices, as well as bullish or bearish trends in the market.
Inside the candlestick chart, you will find the "Bollinger Bands", a tool that will show you market volatility and help you identify possible turning points in prices.
Below the candlestick chart, you will have access to three powerful indicators: "MACD" (Moving Average Convergence/Divergence), "RSI" (Relative Strength Index) and "Stochastic Oscillator". These indicators will provide you with valuable information about the strength and direction of market trends, helping you make better decisions.
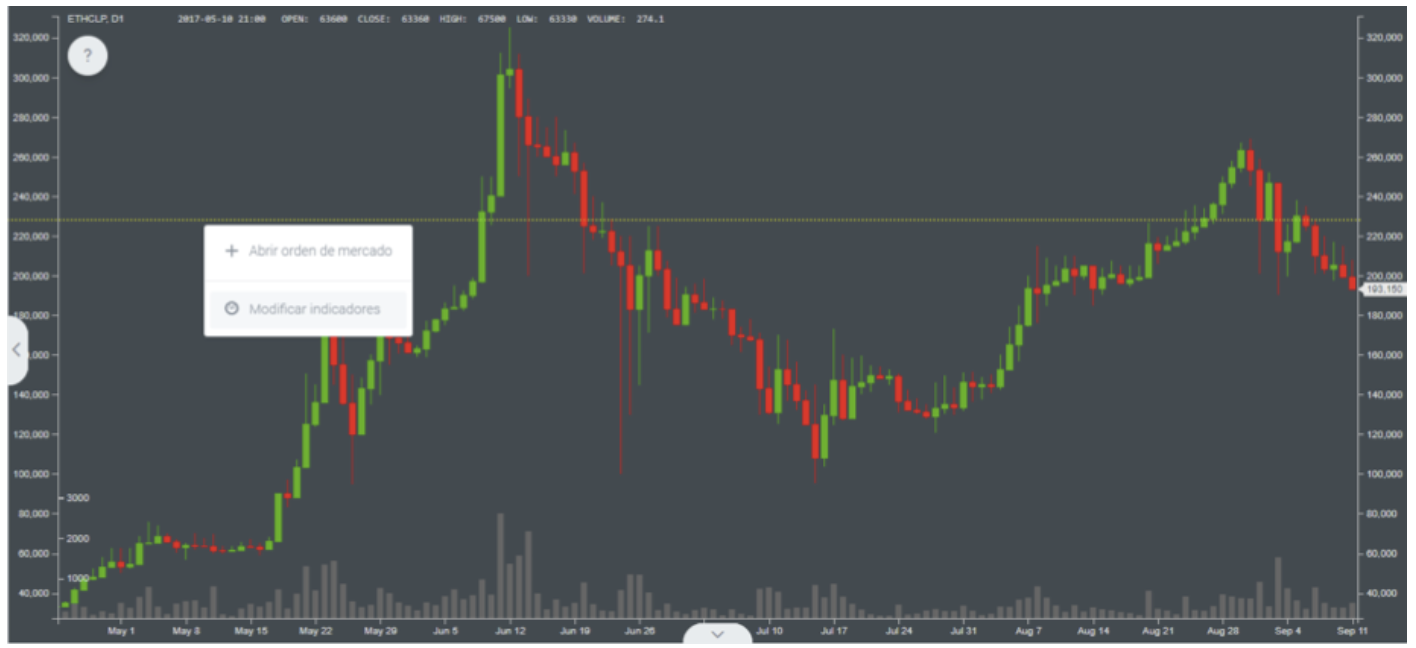
Adding indicators to your candlestick chart is very easy!
Simply follow these steps:
Right click on the candlestick chart.
Select the "Modify Indicators" option from the drop-down menu, as shown in the image.
A list of available indicators will appear. Choose the indicator you want to add to the chart, for example, "Bollinger Bands", "MACD", "RSI" or "Stochastic Oscillator".
Once the indicator is selected, you can customize its configuration according to your preferences.
Click "OK" to add the indicator to the chart.
Leveraging Technical Analysis Tools in CryptoMKT
Ready! You will now have the indicator you selected visible on the candlestick chart, allowing you to perform more detailed technical analysis and make informed decisions based on the information provided by the indicator.
Importance of Prior Knowledge
It is important to note that these tools require a certain level of prior knowledge to use them correctly. We recommend that you thoroughly study their operation before using them, this way you can make the most of their advantages and reduce the risk associated with their use.
Steps to Follow:
Study the Operation of the Indicators: Familiarize yourself with the different indicators available and understand how they work.
Practice: Use demo accounts or simulations to practice before trading with real money.
Continuous Analysis: Keep constant track of your analytics and adjust your strategies as necessary.
Limitations and Considerations
It is essential to keep in mind that these tools analyze past data and do not guarantee future results. However, with the information they provide you, you will be better prepared to make informed decisions and maximize your profits in your operations.
Remember:
Historical data: The indicators are based on historical data and should be used as a guide, not a certainty.
Risk management: Implement risk management strategies to protect your investments.
Constant update: Stay informed about the latest trends and updates in the market.
Thank you for trusting us and being part of our community! At CryptoMKT, we are committed to your success and continue to develop tools and resources to help you achieve your financial goals
Related Articles
Margin Trading: Amplify your Market Opportunities
Margin Trading, also known as operating with leverage, is a tool that allows you to maximize your opportunities in the financial market. This strategy, available on CryptoMKT, offers you the ability to trade with more capital than you have, which can ...Exchange Pro: Discover how to trade cryptocurrencies on CryptoMKT
Exchange Pro gives you the ability to create market orders and carry out trading operations on our platform. Discover the advantages of trading with cryptocurrencies here! Exchange Pro allows you to explore and trade in 7 fundamental sections that ...Difference between SIMPLE and Exchange Pro on CryptoMKT
The main difference between SIMPLE and Exchange Pro in CryptoMKT lies in the level of complexity and control they offer users when carrying out cryptocurrency operations. SIMPLE SIMPLE It is an option designed for beginner users or those who want to ...What are open/active and historical orders?
Understanding Active Orders vs. Historical Orders on CryptoMKT At CryptoMKT, it's important to understand the difference between active orders and historical orders: Active Orders: These are orders that have not yet been executed. You can find them ...Difference between SIMPLE and PRO
The main difference between SIMPLE and Exchange Pro on CryptoMKT lies in the level of complexity and control they offer users when trading cryptocurrencies. SIMPLE: SIMPLE is designed for beginners or users who want to execute transactions quickly ...